(2 of 4) Network Meta-Analysis: Statistical Synthesis of Study Data
Characteristics of included studies:
We will generate descriptive statistics for the trial, and study population characteristics across all eligible trials, describing the types of comparisons and some important variables, either clinical or methodological (such as year of publication, age, severity of illness, sponsorship and clinical setting).
We will present the evidence in the network diagram using graphical tools that allows for appropriate visual representation of the included studies. To understand which are the most influential comparisons in the network and how direct and indirect evidence influences the final summary data, we will use the contribution matrix that describes the percentage contribution of each direct meta-analysis to the entire body of evidence.
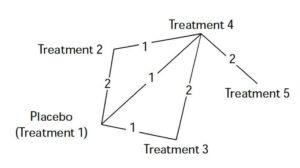
Figure 1. A proposed Parkinson’s network diagram involving 4 adjunctive therapies. Each edge of the diagram represents a treatment. Lines connecting the neighboring edges indicate direct comparison of the pair of treatments. The numbers on the lines are number of studies that have made such comparisons. Therapies 2, 3, and 4 were evaluated in placebo-controlled trials; while treatment 5 was only evaluated against treatment 4 in separate trials. Additionally, two studies conducted head-to-head comparison of treatment 3 against treatment 4; and one study reported head-to-head comparison of treatment 2 with 4.
Figure 1 is a visual representation of the network diagram, where each edge represents a treatment. The connecting lines indicate pairs of treatments which have been directly compared in randomized trials. The numbers on the lines indicate the number of trials making that comparison. The number of edges and the overall shape of the diagram is determined by number of adjunctive treatments and trials that compared them.
Pairwise meta-analyses:
For each pair-wise comparison, we will synthesize data to obtain summary standardized mean differences (SMD, Cohen’s d) for continuous outcomes or ORs for dichotomous outcomes, both with 95% Credible Intervals (CrI). We will use a random effects model to incorporate the assumption that the different studies are estimating different but correlated treatment effects. Possibility of statistical heterogeneity will be investigated by comparing the posterior distributions of the heterogeneity parameters to their predictive distributions. Finally, heterogeneity will be quantified via the I2 statistics and its calculated 95% credible interval (CrI).
Network meta-analyses:
We will conduct a random effects NMA to synthesize all evidence for each outcome and obtain a comprehensive ranking of all treatments. Arm-level data and the binomial likelihood will be used for dichotomous outcomes. We will account for the correlations induced by multi-arm studies by employing multivariate distributions. A single heterogeneity parameter will be assumed for each network. For all pairwise comparisons, summary ORs or SMD will be presented in a league table. We will also estimate the prediction intervals to assess how much the common heterogeneity affects the relative effect with respect to the extra uncertainty anticipated in a future study. To rank the various treatments for each outcome, we will use the surface under the cumulative ranking curve (SUCRA) and the mean ranks.
In our next blog…
we’ll discuss considerations when assessing data from NMA.